For some problems you can get the true fitness of a solution. If you, for example, are maximizing a known mathematical function of many variables, you immediately know exactly how good your solution is. However, for most interesting problems you will never know the true fitness. If you are evolving parameters for a poker playing program, a stock predictor or a walrus image classifier, you never know quite how good your solution is in general. The best you can do is try your solution on a number of test cases and assume that your average performance on those tests are the same as your average performance when the number of test cases approach infinity.
An optimization algorithm will often become over-specialized in the test cases that it is trained on. To combat this, a method called "holdout validation" is often used. The data is divided up into several disjunct sets - a training set used for fitness calculation of the millions or billions of proposed solutions, a validation set for validating the fitness of solutions that are candidates of being the most promising so far and a test set for testing the final solution of your run. Often you will make several runs of your optimization algorithm with different types of inputs and parameters. The test set is used to decide which of the runs produced the best solution.
This standard approach will sometimes work, but there are problems. If your fitness function is very volatile and test cases are hard to come by, you can never be quite sure how consistent your solution is. What is the chance that a solution will happen to get lucky on all three sets of test cases? Low? If I am persistent and keep running the same optimization problem on my computer cluster with the inputs prepared differently and different parameters until I get something that finally pass my tests, what are the risk that after billions and billions of tries, I have just found a fluke that will not perform well on further data? Obviously one can never be completely sure, but it would be nice to at least know what the probability is that we have found a real solution.
One possibly more effective way of using your data is to employ cross validation, but if you test several solutions, the problems with "luck" will reappear.
I'd like to explore a different theory that I have been tinkering with.
Gates - an introduction
In this introduction, I will make a number of simplifications, assumptions and ungodly approximations. I hope to remedy this in the next post.
Let us take the problem of walrus image recognition from the introduction. Imagine that we have a number of subaquatic images. Half of them depict sea weed, lobsters and whatnot and half are of walruses. A good walrus classifier will identify over 70% of the images correctly.
Let us further make the assumption that a walrus classifier is either good or bad, with nothing in between. This assumption can not be entirely true, since an optimization algorithm needs a way to arrive at its solution through gradual improvement, which means that there must be somewhat good solutions. Nevertheless, it will have to do as an approximation for now.
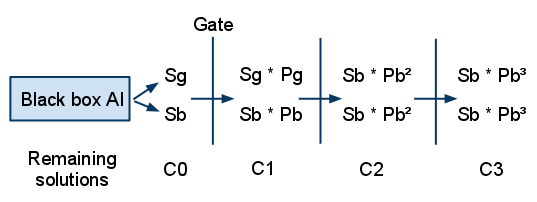
Assume we have a black-box algorithm that spits solutions at us. We will call the number of good solutions at a certain time Sg and the number of bad solutions Sb. The total number of solutions, C0, is just C0 = Sg + Sb.
Take the images that the algorithm did not get to see and divide them randomly into three equally large sets. Each set is now a Gate, which will let through only those solutions that can correctly classify above 70% (it does not have to be the same as our target percentage) of the images in the set. We can assume that it is approximately equally hard to get through any gate. This assumption can be tested by simply sending our solutions through each gate and check that roughly the same number of solutions pass.
Unfortunately there is a chance that a bad solution could get lucky and pass the gate (a false positive) or that a good solution could get unlucky and fail (a false negative), but for a meaningful test, a good solution must always have a better chance to pass the gate than a bad solution.
Let us define the probability that a good solution passes a gate as Pg and the probability that a bad solution passes as Pb. As the number of test cases in each gate approaches infinity, Pg will approach 1 and Pb will approach 0.
If we set up an experiment where we first send our solutions through the first gate, then send the survivors through the second and finally those survivors through the third gate, we can measure the remaining population size at four points. After the black box: C0, after the first gate: C1, second gate: C2 and third gate C3.
If our gates are testing anything relevant and our population consists of both good and bad solutions (Sg != 0 and Sb != 0) we can immediately see that the ratio between successive gates should decrease C0/C1 > C1/C2 > C2/C3, because there will be a greater ratio of good solutions to bad solutions after each gate and Pg > Pb. In plain English - a smaller percentage of the solutions should disappear each time, as the population gradually contains more good solutions. If this does not hold, we must either have bad gates (too few test cases or something) or no good solutions or no bad solutions. As the ratio of bad to good solutions decrease, C(i) / C(i+1) will approach Pg as most solutions will be good.
Fortuitous results
The number of good solutions that remain after the first gate is Sg * Pg and the number of bad is Sb * Pb. Thus we get four equations:
C0 = Sg + Sb
C1 = Sg * Pg + Sb * Pb
C2 = Sg * Pg2 + Sb * Pb2
C3 = Sg * Pg3 + Sb * Pb3
Since we have four equations and four unknowns, Sg, Sb, Pg and Pb, we should be able to solve what the ratio of good to bad solutions is and what the characteristics of the gates are. Subsequently we can tell what the chance is that we pick a good solution if we randomly pick one after a certain number of gates. We can also tell how many solutions we will need to generate on average until we have at least one solution that passes through a certain number of gates.
There is nothing magical about three gates. If we use more gates with fewer tests in each (thus making Pg and Pb closer) we will get different characteristics. This will result in more equations and the variables will be overdetermined, but they can still be determined using, for example, a least-squares fitting. Trying different number of gates and different gate sizes can help us find the optimal use of our test cases.
It is important that Pg and Pb are roughly the same for each gate, in other words that one gate is not significantly harder or easier to pass through than the others. If the gate sizes are large this is more likely to be true. It is straightforward to test this assumption. You can either:
- Do the simple test described earlier, making sure that C is roughly the same for each gate.
- Put the gates in different order and re-run the experiment, verifying that the results are the same.
- Run the experiment several times, dividing the test cases into three entirely new gates each time and determine the standard deviation of the calculated parameters.
If C is not roughly the same for each gate, you need larger gates. Go find more data or use fewer gates, but no fewer than three. That simple. (Almost.. we have not defined exactly how rough "roughly" is)
Caveat
So.. Is everything solved that easily? Can we now go out and confidently optimize the world as the title suggests? No, but I believe this approximation can be of great use as it stands. Earlier we made the assumption that solutions are either good or bad, instead of somewhere in a continuous fitness spectrum. In my next post, I will explain why this makes things a bit more complicated.


It seems reasonable course. have you tested it yet? I mean compared to other methods.
ReplyDelete@JP I show some testing here: http://fakeguido.blogspot.com/2010/04/gates-in-practice.html
ReplyDelete